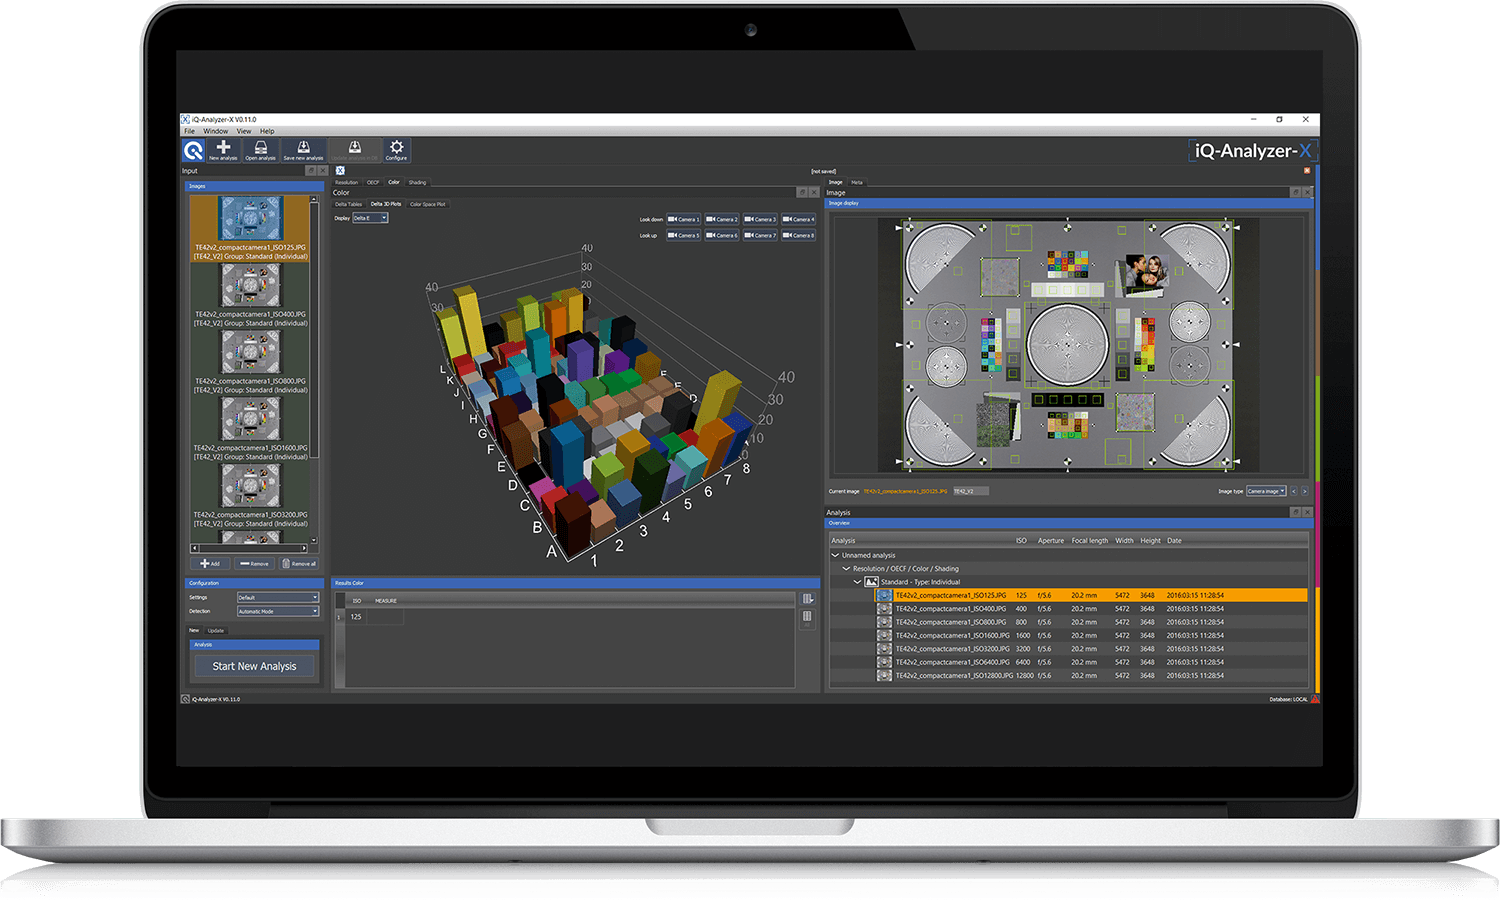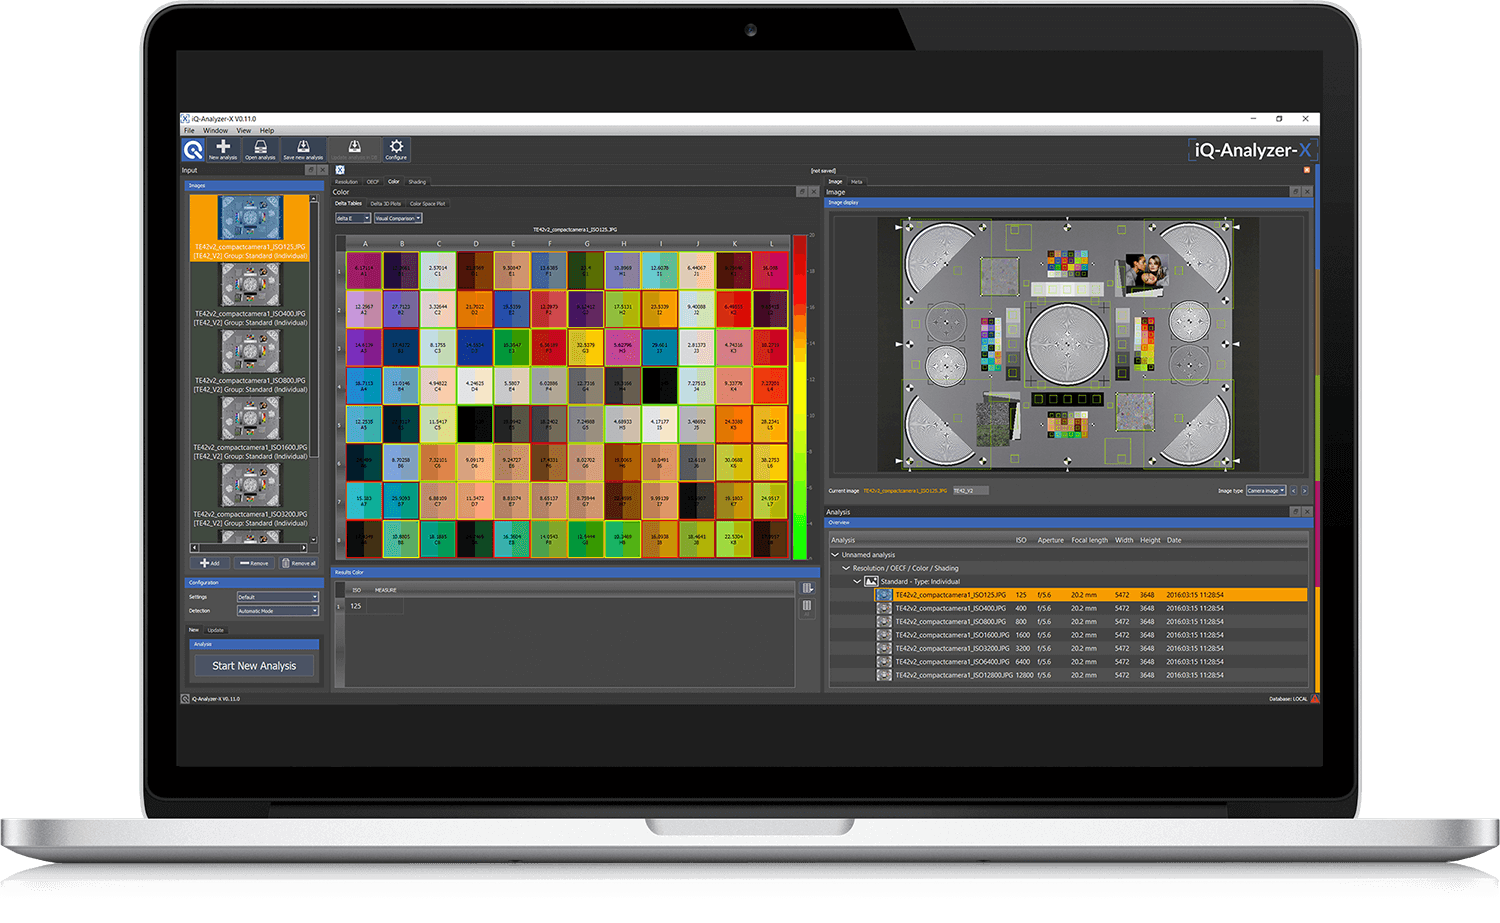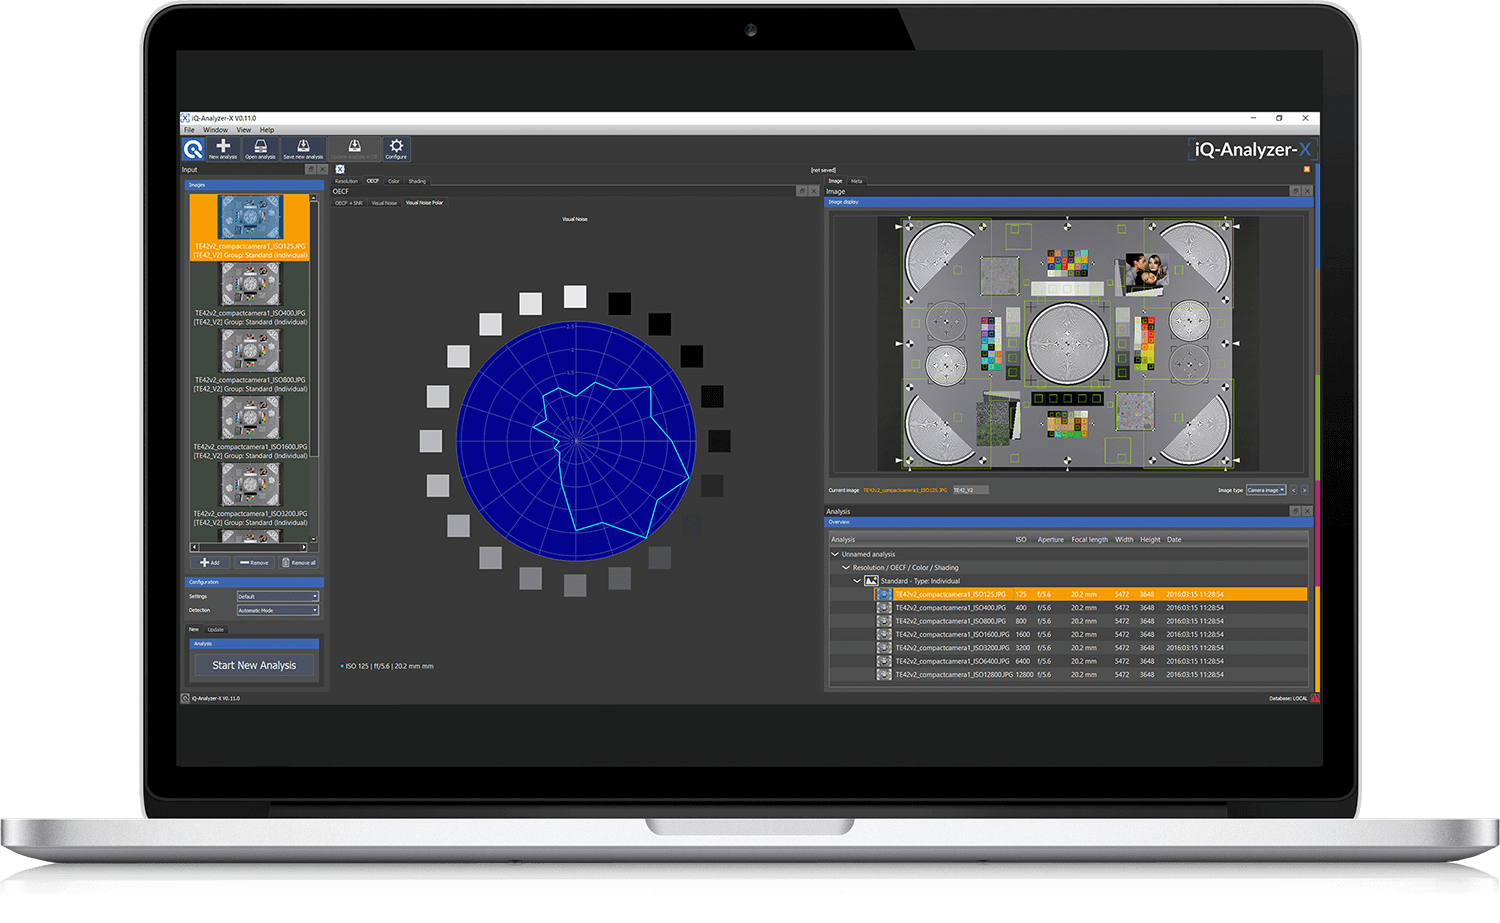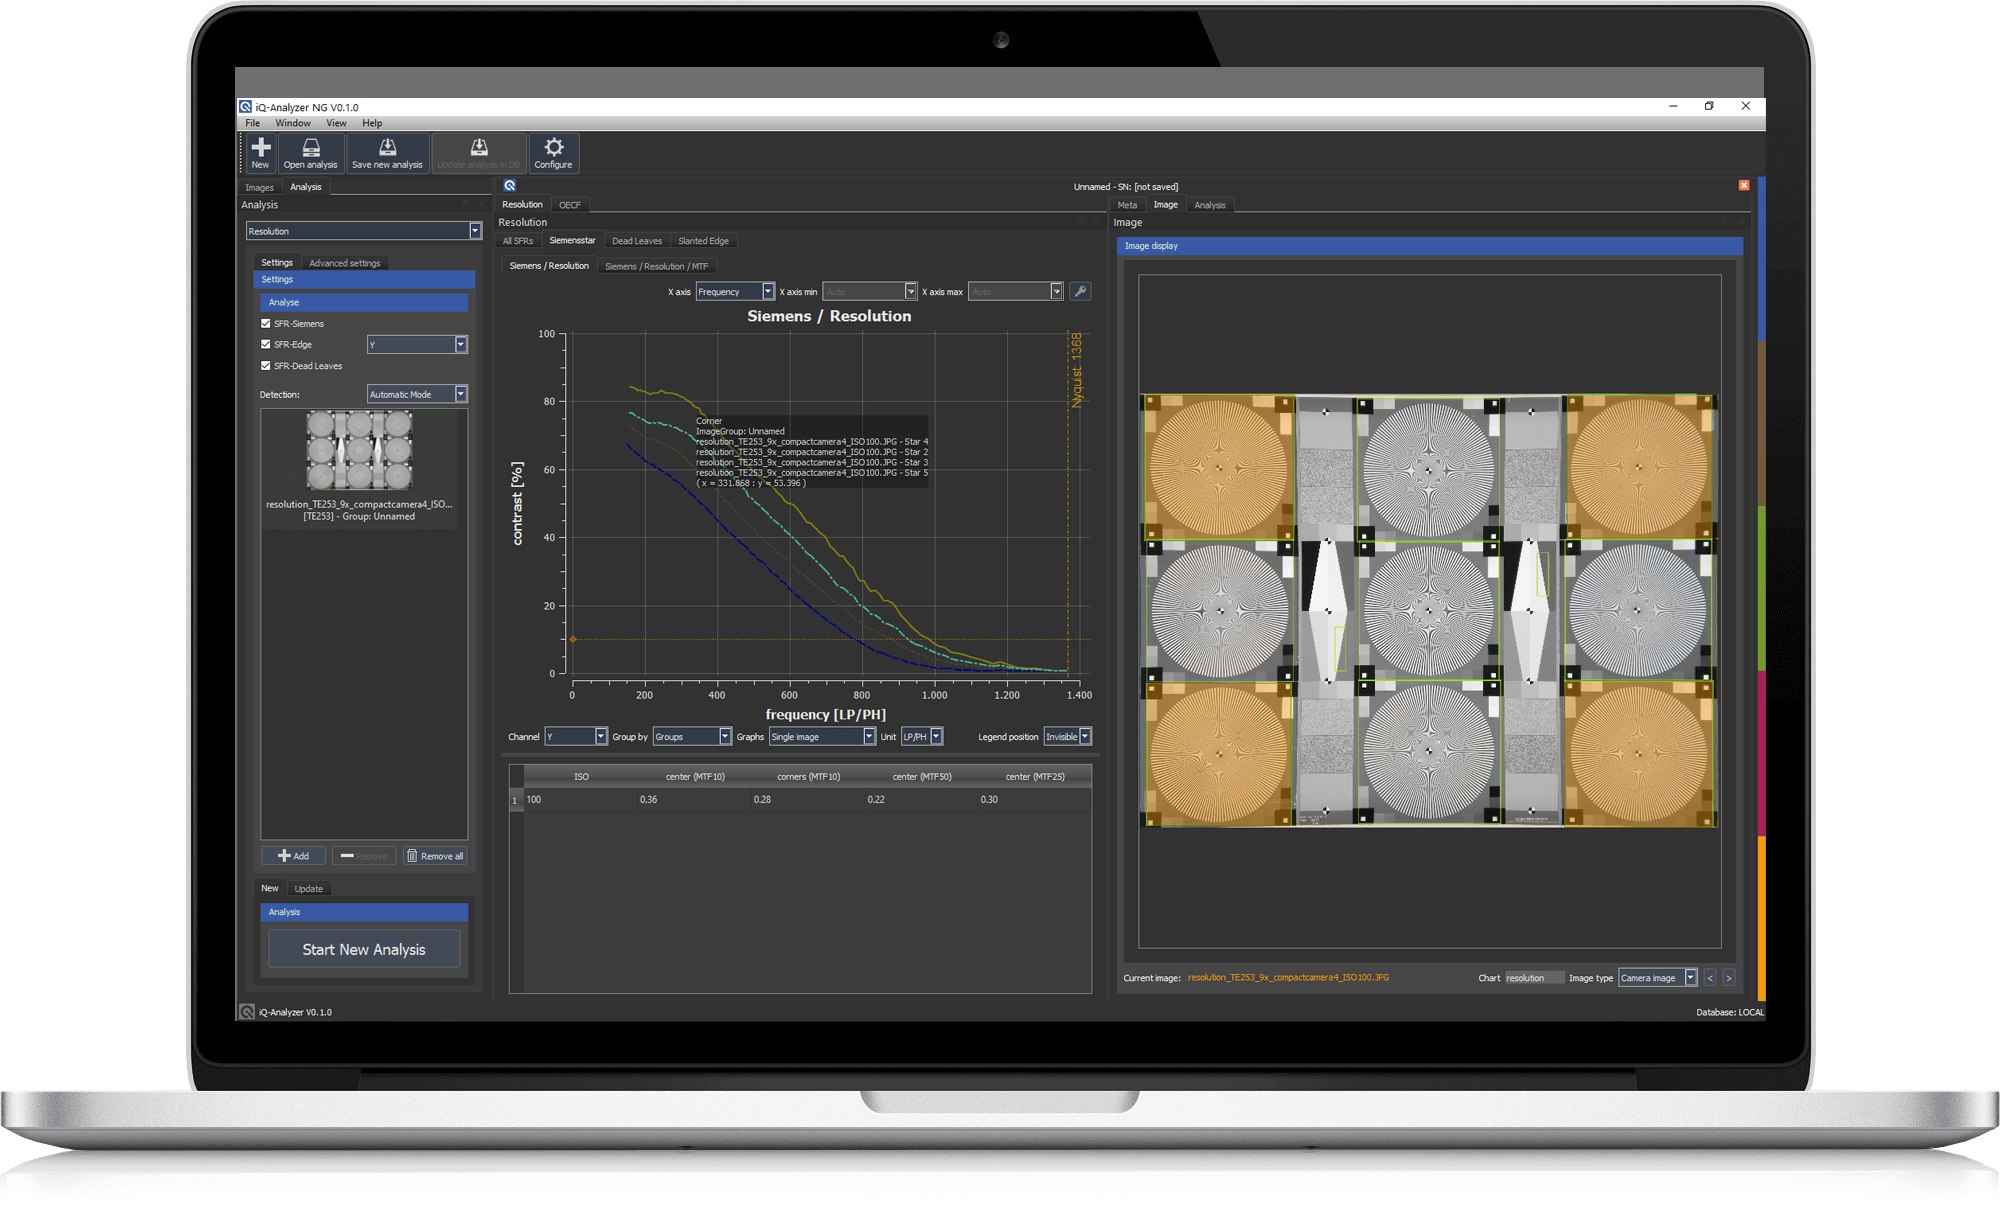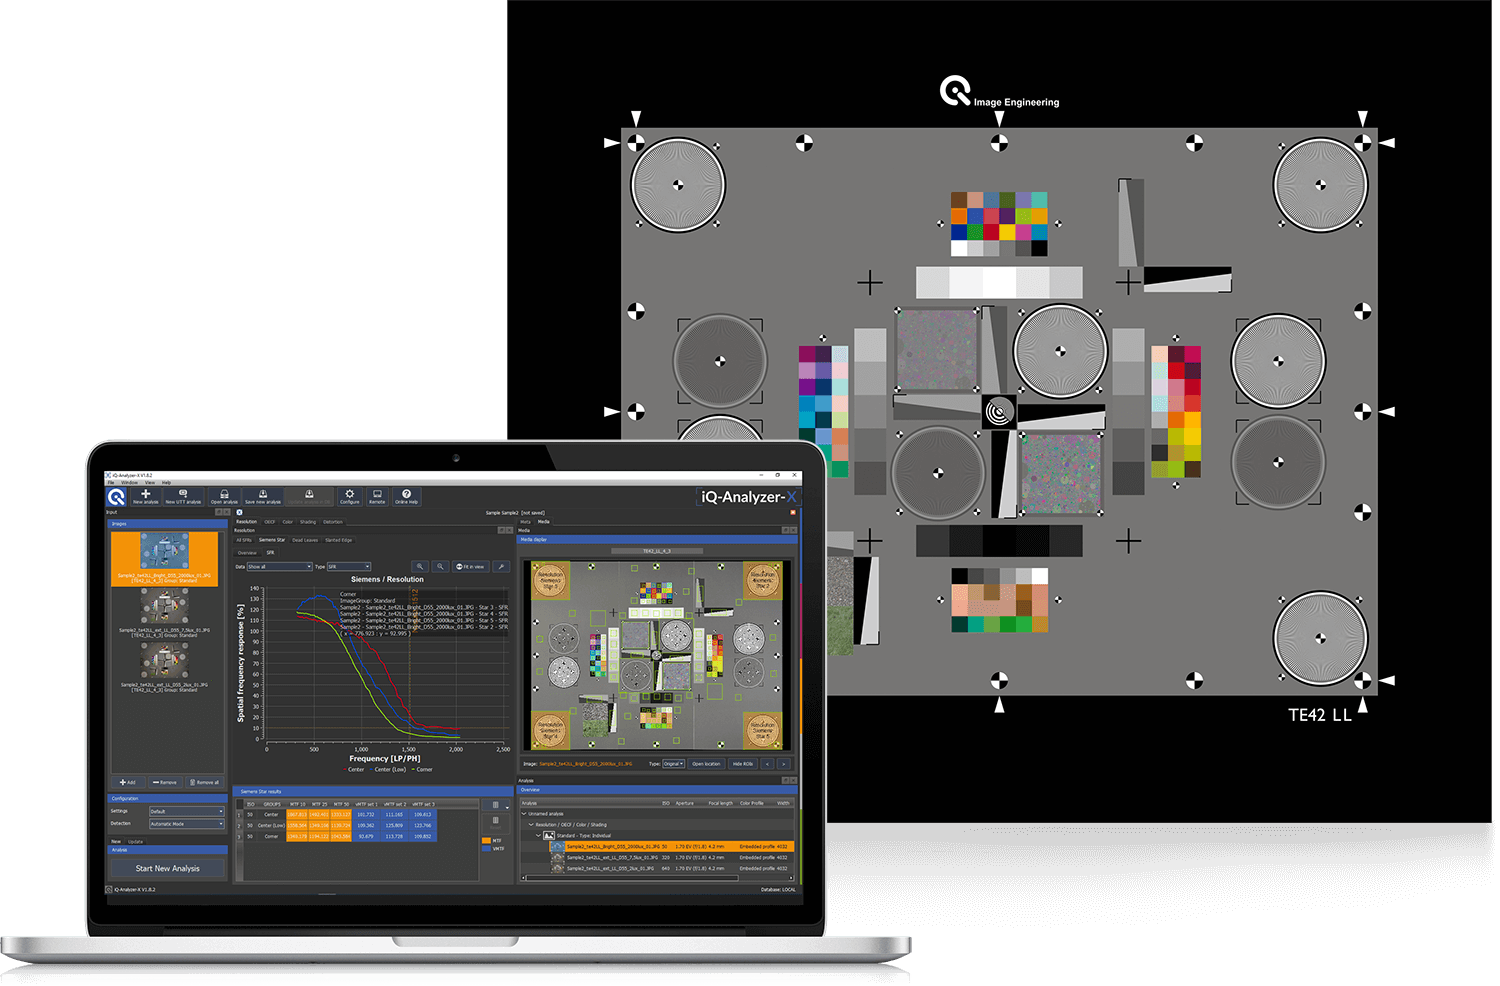
The iQ-Analyzer-X introduces the next generation of image quality evaluation. In this iteration of the software, we’ve built entirely in C++ and introduced new AI-powered tools to deliver an exceptionally modern, advanced camera analysis platform for professionals looking to improve image quality testing of their image capture systems.
This software is ideal for camera and sensor developers during end-of-line testing who are looking to understand how their systems perform against a variety of image quality performance factors, including resolution (SFR), texture loss, dynamic range (OECF), color accuracy, lens distortion, shading, flare, low-light, and noise.
In previous versions, we relied on Mathworks Mathlab, which often limited our flexibility. Using C++ has increased workflow flexibility and allowed us to design an advanced, user-friendly interface. It also allows us to create script interfaces and access low-level APIs.
In addition to a more balanced, flexible user interface, we have introduced AI-powered test chart detection tools to improve the speed and accuracy of image quality analysis. Captured results are quickly identified, and the target features and ROIs (regions of interest) are analyzed. Results and testing parameters can be stored in a local or server-based database to enable comparisons of test results across labs and for future evaluations.
The software supports image and video files, including those from external webcams, integrated cameras, live streams, and capture servers. It also offers automation features, such as hot folders and command-line interfaces, to further improve testing efficiency.
The iQ-Analyzer-X is compatible with numerous test charts, including our TE42 multipurpose series and custom-made charts. Using a TE42 multipurpose chart with the iQ-Analyzer-X provides a high-speed analysis solution, enabling you to evaluate multiple image quality factors in a single test image.
Compatible Test Charts
Review all test charts compatible with the iQ-Analyzer-X. Contact our support team for additional or custom charts.