Introduction
Image distortion occurs when the straight lines of an image appear to be deformed or curved unnaturally. There are three types of lens distortion called barrel, pincushion, and waveform (also known as mustache) distortion. It is important to note that distortion occurs differently depending on the lens system and whether the lens can or cannot be removed from the camera.
In general, rotationally symmetric optical systems function to form an image that is geometrically similar to the object. There are a few exceptions for some particular systems, such as fish-eye lenses, where geometric conditions are deliberately not maintained. Ideally, this function is accomplished according to the geometry of perspective projection. Deviations from the ideal image geometry are called distortion.

Figure 1: An example of barrel and pincushion distortion
How does distortion occur?
Distortion commonly occurs from aberrations near the edges of an image. Each type of distortion usually develops through different variables. Barrel distortion, for example, is often the result of a lens at full zoom, while pincushion distortion occurs most often from telephoto lenses. Waveform distortion results from a large angle camera in zoom mode, combining both barrel and pincushion distortion.
How to measure distortion
ISO 90391 is the standard that defines methods to measure a lens that is separated from a camera. Sometimes, however, you cannot remove the lens from a camera (such as in a mobile phone), and thus the time-consuming methods described in ISO 9039 will not be adequate. As a result, ISO 178502 was introduced to define methods to measure distortion using a camera lens combination.
TV distortion method (ISO 9039)
The oldest method that uses the camera-lens combination is the TV distortion method, created to analyze TV camera systems. This method requires a test chart with a regular grid of geometric structures such as those shown below.
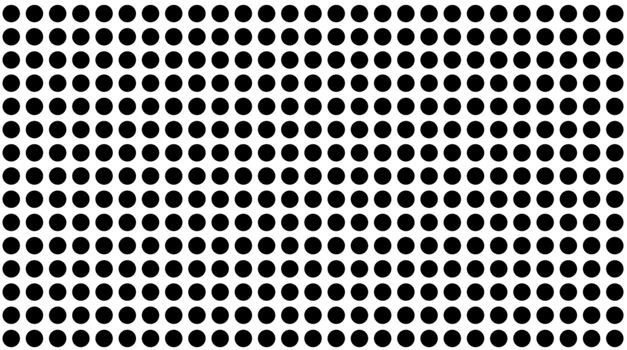
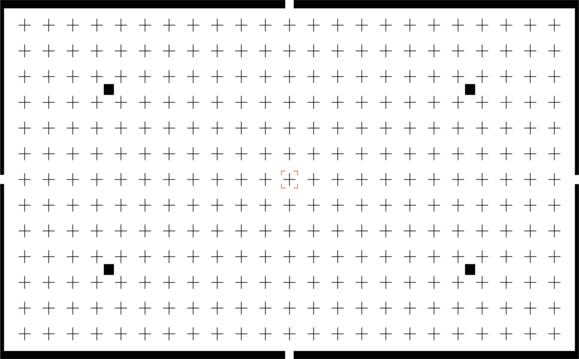
Figure 2: The TE260 (left) dot chart and the TE251 grid chart are two popular charts for measuring distortion
The TV distortion method is essentially a system that shows a steadily increasing distortion from the image center to the corners. The bending of a straight line in the original image is quantified at the image's top edge (see figures below). The ratio of the bending over the height of the image multiplied by 100 is the percentage of picture height distortion. This method is compliant with the process described in EBU Tech 3249 32493.
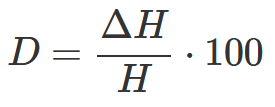
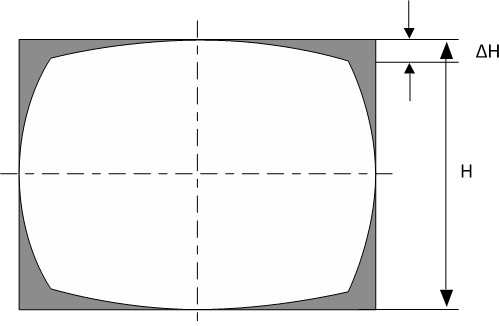
Figure 3: Picture height distortion with barrel shape (negative)
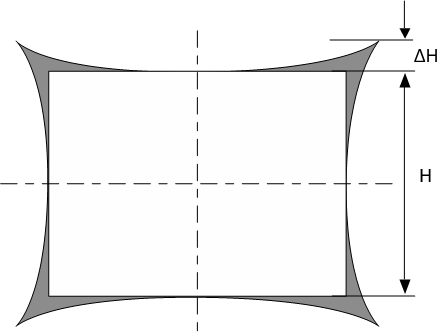
Figure 4: Picture height distortion with pincushion shape (positive)
Line geometric distortion method (ISO 17850)
Specific lens systems (particularly small ones in mobile devices) will correct distortion at the maximum image height. These systems show the highest distortion level at lower distances from the optical center. The resulting type of distortion is often a mixture of barrel and pincushion distortion and is described with the term wave distortion.
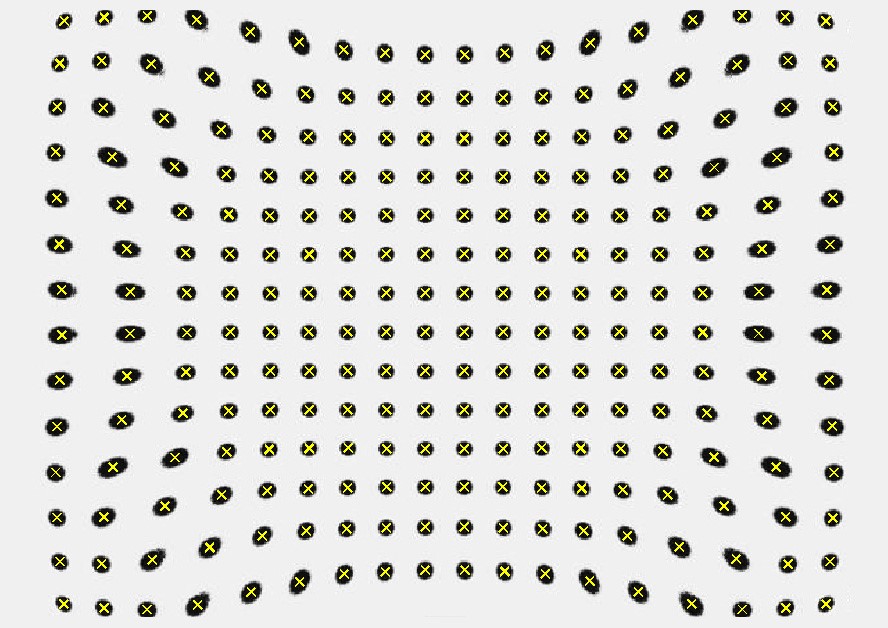
Figure 5: Line geometric distortion creating the pincushion effect
For systems with a wave distortion, the measured picture height distortion can be zero or close to zero even if a strong distortion is visible in the image. We can break down the line geometric distortion method into three different methods to measure these systems' distortion as specified in ISO 17850.
1) Horizontal line distortion
This method is applicable when the vertical line Ai is located closer to the vertical line at the center of the image than to Bi, use formula 2:
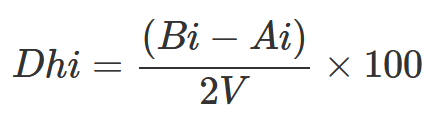
Otherwise, use formula 3:
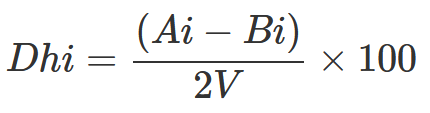
Where:
i = a suffix representing each picture height;
Ai, Bi, and V shall be represented by the number of pixels from the output image.
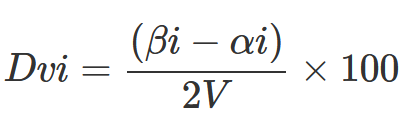
2) Vertical line distortion
Use this method when the horizontal line αi is located closer to the horizontal line through the center of the image than to βi, use formula 4:
Otherwise, use formula 5:
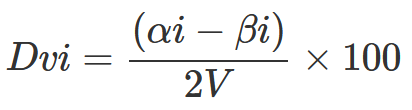
Where:
i is a suffix representing each picture width;
αi, βi, and V shall be represented by the number of pixels in the output image.
3) Total line distortion
The total line distortion is calculated as:

The sign for Dlinei represents the higher absolute value of either the horizontal or the vertical line distortion.
Local geometric distortion method (ISO 17850)
The local geometric distortion method is utilized when a single number for the distortion is not sufficient. In other words, we need a function for the distortion to correct the distortion in image processing. Keep in mind that when you need to address a specific image height, the local geometric distortion is more reliable.
When measuring the local geometric distortion, we assume that the distortion close to the optical center is zero. Then you can calculate a regular grid based on the geometric positions of the nine structures (3x3) in the center of the image. This grid is expanded to the whole image and defines the nominal positions for each of the structures.
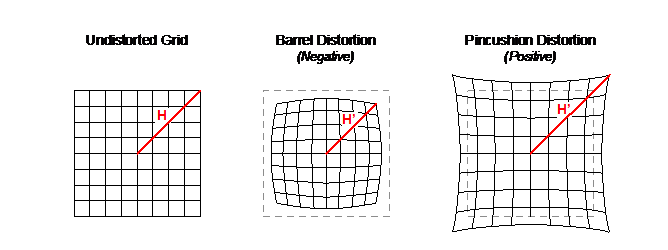
Figure 6: H-values for determination of the local geometric distortion
The distortion is then measured using the following formula:

Where:
H* is the distance of the dot from the image center
H is the nominal distance of the dot from the image center based on an expanded regular grid.
If deriving a single number from the local geometric distortion, the maximum distortion measured for any of the image's geometric structures is the one that is reported.
ISO 17850 describes this method in detail.
Conclusion
Image distortion is when the straight lines of an image appear to be deformed or curved unnaturally, creating different distortion types, including barrel, pincushion, and waveform. Distortion is often the result of the lens's geometrics and can significantly disrupt the image's quality.
It is essential to test and analyze lens distortion to ensure high image quality. We recommend following ISO 17850 and using proper test charts to capture various images using different lens functions, e.g., zoom. We then suggest analyzing the results using evaluation software (e.g., iQ-Analyzer-X) to see where you can improve the camera system.